By Lucie Parrot, eng., M.eng., CVS-life, FSAVE
The purpose of a function tree is to illustrate all the functions that a product, a process or a project[1] must do and the links between them, in order to challenge these functions and develop a better response to the client’s needs. The functions are linked together in a logical way and the model resulting from this diagram illustrates what will be done by the product, starting with a statement on the mission of the product, and presenting all the functions.
The best analogy we can use to illustrate a function model is to compare it to a puzzle: when you open the box of a puzzle, you see the 1000 pieces that you will have to connect to see the desired picture. It is the same thing for a function model: you start by finding the functions of the product (the pieces of the puzzle) then you assemble them to obtain the model of the product (the picture). If you are missing functions, you can add them as you build the model (like adding pieces of the puzzle that you found outside the box) and if you have functions that don’t fit, you remove them (pieces of another puzzle).
The function diagram does not represent the chronology of what the product does. Indeed, no chronology whatsoever is considered here, only logic. This statement is remarkably true when a diagram represents a process, where the common mistake is to place the functions in a chronological order, instead of asking what the “how-why” logic is.
The function diagram is also not a work breakdown structure, because it does not represent any technical solution. It only shows the functions that a product will do to satisfy specific needs.
Let’s explain here how to build a function diagram and the many uses of it.
How to Build a Function Diagram
As for any FAST diagram, the functions are linked together with a HOW-WHY logic. The HOW goes from left to right and the WHY comes back, from right to left. There is also a more subtle relation: the WHEN. It does not represent WHEN meaning “at what moment”, but more like “when we realize this function, what is the underlying goal related to it?” The answer to this question is located underneath the function, but a little creativity is possible here: if no place is available under the function, it can also be placed above.
The other logical relation that can be represented in a function tree, as for FAST diagrams, is the AND and the OR relation.
Again, as for any FAST diagram, the level of abstraction lowers from left to right, with the high level functions on the left and the low level on the right of the diagram.
Finally, we can distinguish a few types of functions:
- Basic function: it is the essence of the product under study. It is the main reason why your client wants your product. If this function is not realized, the product is useless.
- Supporting function: these functions support the basic function and help sell the product. They facilitate the realization of the basic function by making it easier to accomplish, or safer, or faster … and this aids in selling the product.
- Constraint function: those are imposed upon the designer by others and must be respected. These functions can be brought by environmental considerations, by the market, by regulatory agencies … but they must be carried out, or else you will not be able to sell the product.
With these few rules dictating how to build a function tree diagram, we have all we need to start one.
Building a Function Tree
As mentioned earlier, it is easier to first identify the functions of the product that will be placed in the diagram. A few methods exist and the choice belongs to the facilitator.
Many texts are available to understand how and when to use any of these methods, in order to elicit the functions of a product. These methods will identify functions that are either of a high level of abstraction that will be placed on the left of the diagram or of a lower level of abstraction, on the right of the diagram.
But the first thing to place in the diagram is the fundamental mission of the product (its task). This describes the raison d’être of the product. It is often composed of more than two words, unlike functions which are described with an active verb and a measurable noun.
Once the mission statement is chosen, with the client, it is placed on the leftmost side of the diagram and will be the starting point of the tree graph. It is possible to place another function on the left side of it, to better explain the context for example, but this other function will not be part of the study.
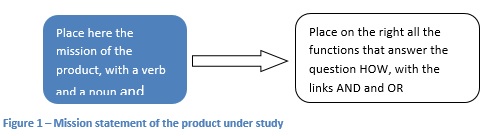
On the right of the mission, we place the functions that answer the question HOW. We find the functions we want to place here either in the list of elicited functions or by creating new ones. Obviously, the first few times, it is easier to elicit functions before starting to build the diagram, but this construction process allows you to sometimes elicit more functions.
The diagram is built by placing three or four functions at a time, going to the right (answering the question HOW) then by validating the links, reading from right to left, with the question WHY. The role of the facilitator is important: he or she will read the diagram as it is being built by saying: “How do we realize this function? It’s by doing this function.” The brain of the attendees is wired in such a way that a false reading will automatically make it react and thus, the function will be moved to a place where it is more logical and appropriate. Many computer tools exist to help building such diagrams.
In a function tree, the top of the diagram is where we tend to place the basic function(s). Directly below will be the support and constraint functions, which may be placed according to the client’s order of importance.
Different Types of Trees
The differences between a function tree and a FAST diagram are that the function tree will not be focused on the “critical path” of functions, and also that there will be no functions “floating around”, as the one-time function and all-the-time functions do. Everything is attached.
As for the difference between the function tree and the customer function model (client-oriented diagram), the four functions the client diagram uses (satisfy user, attract user, assure convenience, assure reliability) may be replaced by whatever function is more suitable. Indeed, these four functions may be appropriate when dealing with a product, but other functions may be more relevant if we are describing here a service or a process or another product which does not deal with attractiveness, for example. The function tree model is very flexible.
The following example will illustrate the whole process.
Example of a Function Tree
This diagram represents the function model of the drum system of a clothes dryer.
Let’s read it together:
We can see that the mission of this system is to “dry content in an efficient, pleasant and safe way” (in the leftmost box). But when this mission is realized, the drying process must be done by “resisting operating conditions” (which may vary) and by “respecting standards”. These two functions, when placed upstream of a tree, are true for all the functions that follow. Placing them there avoids repetition at the subsequent levels.
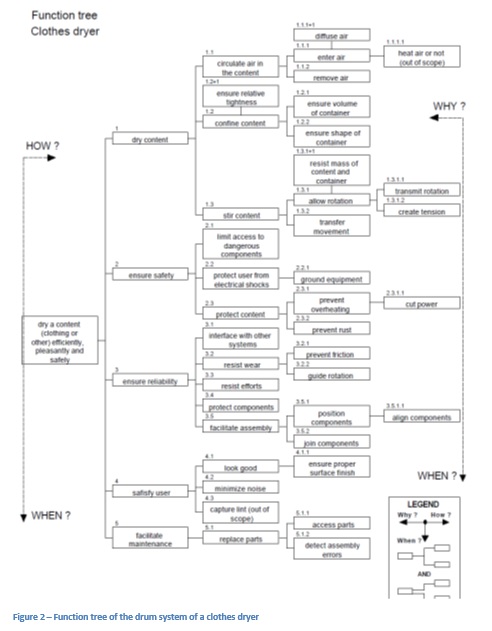
By moving to the right, we answer the question, “How can we dry content, in a safe, pleasant and efficient way?” The answer is: by drying the content AND by ensuring safety AND by ensuring reliability AND by satisfying user AND by facilitating maintenance. We can see here that function 1, “dry content”, is the basic function of the product. Indeed, if a dryer does not dry the content we place inside, it doesn’t do its job and it is thus useless. The dryer is designed and therefore bought essentially to accomplish this function, but it must also do it safely, reliably, pleasantly and it must be able to be serviced. Those are all important selling functions. Thus, these functions 2 to 5 are supporting functions: they support the basic function by making sure the dryer not only dries the content but does it safely, reliably… More precisely, function 2, “ensure safety”, would be a constraint function: it is vital that the product be safe and, as the designer and the supplier of this product, all must be done to achieve this goal. Functions 3, “ensure reliability”, 4, “satisfy user” and 5, “facilitate maintenance”, are support functions, because when a product is reliable, it is a great product to use over and over; satisfaction comes from a quiet use and a pretty product and finally, when the product is easy to repair, the client is happy to have it back in use quickly. All those could increase the sales.
In function 3 “ensure reliability” there is a function called “resist efforts”. Indeed, all kinds of efforts are applied to the drum system: weight, mechanical stress, torsion, temperature, even humidity (corrosion). The system must be designed to resist all those which are defined in the functional performance specification. For example: weight of clothing, x pounds, temperature: minus 40 to plus 40 (in the shipping truck), use temperature: y degrees and so on. By defining all the efforts the system must resist, the designers can dimension the components appropriately and select the right materials, in order to have a reliable system.
Let’s extract a branch of this function tree model to have a closer look at it. Each branch is called a “functional group” and it contains functions that belong together.
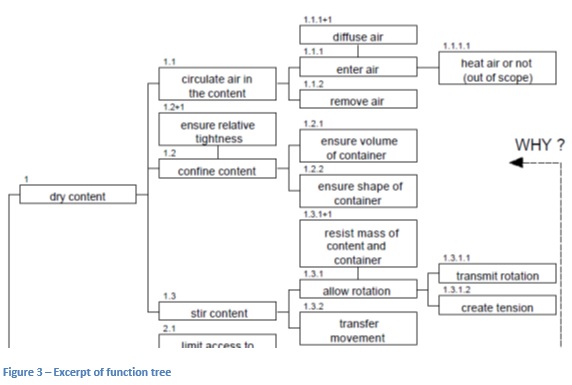
This branch of the tree illustrates in detail the basic function of “drying content”. How do we dry the content? The answer is on the right: the product must “circulate air in the content” (thus removing moisture), it must “confine the content” (it the content escapes, it will not be dried), and “stir the content” (if it stays in a heap on the bottom, it will be difficult to dry). Thus, the three functions must be realized to “dry the content” of the dryer. If we circulate air but we do not confine the content, it will spill out and won’t dry. If we confine it but we do not stir it, the clothes on top will dry but not those underneath. Therefore, to dry the content, the product must be able to concurrently circulate air AND confine content AND stir content. If one of the three functions is not realized then the content will not be dried as expected.
If we continue reading to the right by taking branch 1.3, “stir content”, we can see: How do we stir content? The answer is on the right: by “allowing rotation” and by “transferring the movement” to the content. Here, we have a WHEN function which can be read as follows: when we allow rotation, the product must be able to resist the mass of the content tumbling down. Indeed, when the container turns and applies this movement to the content, the system must resist the full weight of the mass of wet clothing falling to the bottom of the container.
If we read from right to left, we have: why do we “allow rotation” of content and “transfer the movement”? To stir it. Why de we stir it AND confine it AND circulate air? To dry the content.
And so on. Note some of the functions in this actual example use more than two words. Also some are actually “activities.” This example responded to a client request to include the information as shown.
When is a Function Tree Finished?
Once all the functions previously elicited and those added on the way are placed, the diagram may be considered finished. More precisely, when each branch ends with a function for which no more answer can be given to the question HOW (going to the right), other than naming the solution to perform the function (a component, a sub-system, an activity, etc.), then the diagram is finished.
Uses of a Function Tree
A function tree can be used in many ways:
- To challenge the functions we really want to see in the product
- To identify the functions that need to be characterized
- To do function-based creativity in the value engineering job plan
- To distribute the costs or other resources on the functions
Challenging the Functions We Want in the Product
When we are building the function tree diagram, we constantly ask questions: How can we do this? Why do we do it? This forces the participants to ask questions in order to understand the essence of the product: what purpose will it serve? Why do we want it to do some of these functions? What is the basic function? What are the constraint functions? The selling functions? Does this function really serve a purpose? What does the client want?
By analyzing, one function at a time, what the product must do to satisfy a client, the designers get to know the product in its smallest details and the risk of forgetting something is greatly reduced. This risk is significant when we know that finding a problem late can cost 10 times more than finding it at the previous step of the product development process.
Identifying Which Functions Must be Characterized
Characterizing functions leads to the identification of their performance criteria, the performance levels to achieve, as well as the flexibility of these levels. Here again, there are many books that deal with this subject.
However, it is important to mention that the functions usually characterized are those on the rightmost side of the diagram, since they are concrete and detailed. Indeed, in our example, it is hard to express the performance of “circulate air in the content”, but much easier to express the performance of “insert air” and “remove air”. In this case, we can say what airflow is expected.
Feed the Creativity Session
Since the function tree contains only functions (by definition: actions that the product must perform) and no solutions (unlike a WBS-Work Breakdown Structure), it is interesting to use the diagram to stimulate the creativity session of a value analysis workshop. We call it “function-based creativity”.
Since all functions are found in the diagram, it is possible to look at the functions on the right, those that have no answer to them, and ask: what solution could be used to realize this function? Or this group of functions? Thus, many solutions can be identified. Each one can then be combined with other ideas to form interesting product scenarios.
Doing the creativity exercise on a higher level of abstraction (to the left of the diagram) opens up innovation.
Distributing Costs on Functions
A very interesting use of the function tree is the ability to structure a cost model on functions (at the primary level most of the time) rather than on components. It is sometimes impossible for a client to react intelligently to a list of components and their cost, other than by identifying the most expensive components, but if we present the cost of the functional groups, the client can react because he sees how much money is associated to each function. Sometimes one component will do several functions. So costs need to be split up between functions.
To do this cost distribution, we must identify which components are associated to each function at the rightmost of the diagram. The cost of these components represents the cost of the function. Then, the costs of each function included in that sub-branch are added, to represent the cost of each branch, and likewise, the sum of the costs of all branches gives the cost of the product. We roll up the costs from the base of the diagram (on the right) all the way to the mission (on the left). The following example will illustrate this. (The example has been simplified for better understanding.)
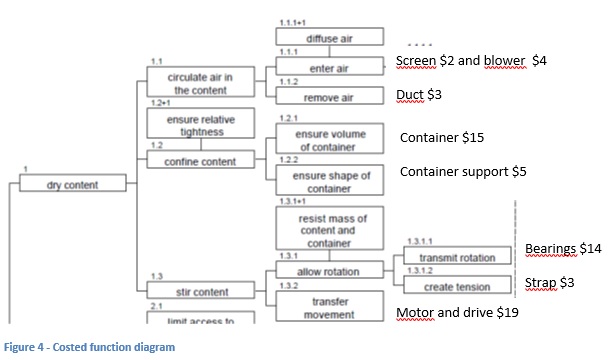
Once the components are identified and associated to the proper function, we can add the costs. Here we see the function “enter air” is done with a screen at $2 and a blower at $4. Therefore, the function costs $6. The function “remove air” is realized with the duct at $3. Thus, the function 1.1, “circulate air in the content” of the dryer, costs the sum of the functions “enter air” and “remove air”, that is to say $9.
The function “stir content” is composed of the function “allow rotation”, which in turn is composed of the costs of the function “transmit rotation” at $14 and “create tension” at $3, adding up to $17, to which we add the cost of the function “transfer movement”, realized by the motor and its drive at $19. Function 1.3, “stir content” of dryer, is thus realized for a total cost of $36.
Likewise, the function “ensure volume of container” is realized with the drum at $15. The function “ensure shape of container” is realized with the drum support at $5. Thus, the function 1.2, “confine content”, costs the sum of the two functions that make it up, at $20.
Often, a component will achieve many functions, thus the cost of the component must be split between these functions. This split must be done in a rational way. For example, if the drum costs $15 and is made of stainless steel to resist corrosion, then the cost could be split between the functions Confine content and Resist efforts (corrosion). How would the split be done? Let’s take the cost of the drum if it were made of “regular” steel, let’s say $12 and apply that part to the function Confine content and the rest, $3 for the stainless-steel material, is applied to the function Resist corrosion because that extra cost is required to accomplish the function. The cost of a surface treatment like paint would do the same thing and be applied in the function Resist corrosion. Why was Stainless-steel chosen over paint? Because of the required level of performance which mentioned the Resist corrosion had a performance criterion of 15 years without corrosion marks. Paint could not achieve that without touch-ups.
This exercise is done until all functions are covered, and the sum of all the functional groups give us what the cost of the product is.
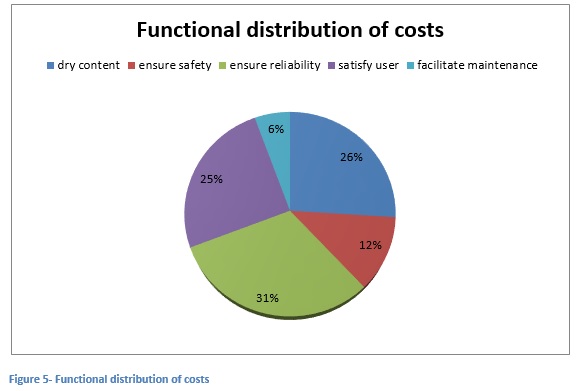
This can then be presented in a pie graph showing the functional distribution of costs (based on first-level functions of the diagram)
The functional distribution of costs can be done at the level where it brings most interest, either at the first level or any other level if necessary. Also, using the diagram helps identify which function is involved with each component. But preparing a cost distribution matrix will do the same job. One axis of the matrix has all the components, the other axis has the functions and the cost is distributed in the matrix, at the appropriate location. Totals are done easily as in any spreadsheet. The functional tree will help identify which functions to place in the matrix.
This example of cost distribution (on the functions at the first level) shows that:
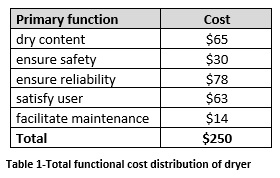
It is easier for clients and others involved in the workshop to comment on statements such as:Table 1-Total functional cost distribution of dryer
It costs about the same amount to dry the content (basic function of the product) as to satisfy user (support function).
- It costs about the same amount to dry the content (basic function of the product) as to satisfy user (support function).
- The function “ensure reliability” is more expensive than “drying the content”.
- There is very little money allocated to “facilitate maintenance”.
With these findings, it is possible to organize a creativity session to identify ways of better realizing the functions with a more balanced cost distribution, according to clients’ expectations.
Other Resources in lieu of Cost
We use whatever parameter is most appropriate. When working on an aircraft engine, (where you don’t need the function Attract User, but use a function called Ensure Safety instead), we distribute the weight because that is the parameter to optimize. In a process, we use time. On the optimization of a subway station, we use square footage (space) because that’s the parameter that had the most constraints, the station was build many years ago and no more space could be added to it, so space had to be used in an optimized way.
History of Function Tree
This type of diagramming started in France at France Telecom. The person who started it came to Canada to give us a class on function trees and function analysis in general, that was early 1990s. The French pushed the method forward and improved it and created standards very early (August 1990). At France Telecom, they used the method and the Functional Performance Specification, to purchase innovative telecom equipment.
It is popular in Canada because the first users (myself and my colleagues of those years) used it right away in workshops with clients and grew a user base on this method. And it has proven very effective. The function tree is a very powerful tool that can be used in many applications: just like in any VA workshop, it is used to identify which functions contain the most money and where we can save money without doing any harm to the product-project-process-service. It is also very powerful to draw a model of the product under development, to understand all the stakes involved and to make sure all the functions are identified and understood by the designers. This allows them also to design with concurrent engineering principles.
Conclusion
The function tree is a powerful tool that allows us to question the purpose and the functions of any product, service, process, or building that needs to be designed to fulfill the needs of users. It allows us to drive creativity by basing it on functions instead of existing solutions, thus enabling more innovation. It also allows us to structure a cost model based on functions instead of basing it on technologies or solutions.
All those are excellent reasons to prepare a function tree in order to design products, processes, services, buildings and others to be more efficient, more competitive and more in line with the needs of the clients, those needs being illustrated in the diagram through the functions. No designer seeking to design the best product should do so without the function tree.
———-
[1] To simplify the text, we will use the term “ product” to represent a manufactured product as well as a software, a building, a business or an industrial process, anything that must be designed and realized to satisfy a client’s needs. All these “products” can be studied with a function tree.