By James McCuish & Charles Jennings
Abstract
 How can Value Engineering / Value Management principles enhance project and organizational management planning, delight teams and organizations in planning their work and engage senior management in implementing organization recommendations? The methods described in this article have been used over more than 2 decades on Major Projects globally with Capital expenditures.
In Major Project development and delivery, decisions are often complex and interrelated, inherently uncertain, multi-dimensional and often highly subjective. Managing and executing these decisions requires a dedicated, and serious commitment to effective multidiscipline communications and interfaces. Application of the FAST methodology to organization mapping has been proven to be a key communication tool between the Owner Organizations, the Project Team and other external groups. This FAST framework application can be understood and owned by all the stakeholders (internal and external), resulting in a unified functional plan. The FAST map is particularly suited for sharing stakeholder intentions and needs without revealing sensitive economic and strategic information.
Introduction
The Organization model (or Map) using FAST creates a framework that portrays the values and inherent project uncertainties as a rational, structured functional plan. The FAST methodology utilizes a “how –why” logic to establish the requisite functional activities required. The resulting (functional) activity map allows the project team to establish the project work load associated with the scope and shareholder requirements before attempting to design and execute the project.
Organization Mapping (FAST Model)
This article explains how to innovatively leverage both the FAST Methodology and available software to significantly improve the deliverables from Project Front End Loading (FEL) workshops targeted to effective Organizational Planning.
We also briefly address methods used to take the output from the Organizational FAST techniques and convert them to resource-loaded schedules in Primavera 6 and/or MS Project or similar.
Using these well-proven Organizational Mapping techniques, teams can clearly portray to senior management the results of a well-crafted Front End Loading study, and understand the resource funding requirements at FEL project stage gates to support effective project delivery.
After an organization has chosen to target results in a system thinking discussion, building the Organizational Map, (or “Organization FAST Diagram,”) it:
- Causes the individuals to “Operationalize” their systems thinking discussion.
- Provides a simple, yet elegant, method to drive down to the detail of the Organizational Functions to be achieved in the System.
- Exhibits the interfaces and dependencies with clarity.
- Differentiates the “As we do it state” from the “As we should do it state.”
- Supports assignment of Roles & Accountabilities.
- Is a tangible graphic to prove the understandings developed in the Teams’ System Thinking work do exist, and which will be referenced in a consistent and repeatable business process.
- Is a reference point for discussions with new team members, other internal Organizations, Clients and Contractors.
- The Organizational Map may be “dimensioned” in a variety of ways, for example:
- What are we doing Well / Poorly?
- What most influences Schedule & Schedule Risk?
- Who will Approve, be Responsible for, Support the effort, of achieving the Organizational Function addressed in the Map.
- What Milestones are agreed to exist.
 The Organizational Map is a superb tool for Leaders to communicate effectively with Teams, other internal Organizations, Clients, & Contractors.
The Organization Map is a ready tool to re-visit when an Organization is presented with challenges of Schedule and/or Resources.
With coaching, some practice, and some reading of the reference material the readers should be able to bring these techniques of Value Management / Value Engineering / Value Improving Practice application to Organizational Planning engagements.
Joint application of the theory of Value Engineering Function Analyses by the Client & Contractors to the Organization Functions gives us a powerful and well proven approach to strategic problem resource allocation.
This paper aims to share how to take the first steps to engage projects with a Value Management approach to conduct Organizational Function Studies. Overview description in how the tool-sets work, and why they are effective in engaging Senior Management and how to apply these techniques to recommendations of resources to be allocated.
Front End Loading (FEL) Background
To put the power of using FAST for Organization Mapping to engage project delivery teams in perspective it is useful to visit the concept of “Front End Loading” which is used by many major companies in progression of their projects and project portfolios.
The “Front End Loading Capital investment in Projects” (FEL) is a phased process by which a company translates its marketing and technology opportunities into capital projects and delivers those projects for execution / building. The process is a structured and integrated approach to maximize capital efficiency by ensuring that projects in the Company are selected and developed based on project alignment with business strategies and executed using the best available business and engineering practices. The process requires demonstrable evidence of cross functional team working and is underpinned by continuous challenge, and effective assurance.
The goal is to significantly improve project life-cycle performance in capital cost, schedule and operability using a set of industry wide external benchmarks (encompassing both input drivers and output metrics).
FEL is critical to project performance. First, the better the FEL, the more accurate the cost and schedule estimates. Second, in addition to greater accuracy, better FEL results in better absolute cost and schedule performance.
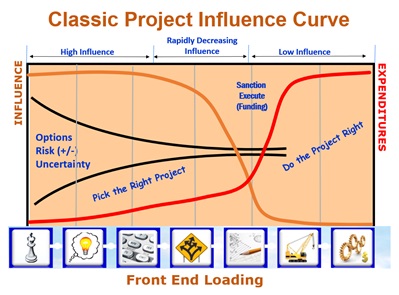 The Classic Project influence Curve graphic shown demonstrates that decisions made on the front end of the project prior to funding sanction have much larger impacts.
It is important to engage the Senior Management early in the project cycle to get alignment of business drivers and the options to be evaluated.
Spending more time getting alignment up front will make the decisions leading to funding (often referred to as sanctioning) the project execution significantly easier
As Projects march through the investment of selection, planning and design the capability to influence project planning and delivery decreases significantly as expenditure increases. Shortly after the point of funding the project for execution, or commitment to building, the capability to influence the design selection decreases dramatically.
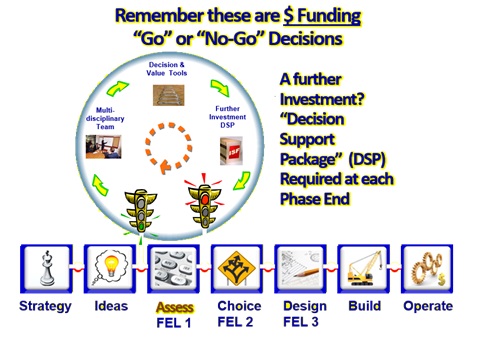
The Process is normally a 2+5 stage process that takes a project (within the context of the business strategy) from initial business through the first year of operation. Between each stage is a gate with a Gatekeeper who is required to make a conscious decision to continue, place on hold, kill or recycle the project based on a Business Case summarizing information documented by the Project Team in a Decision Support Package (DSP). Effective ongoing holistic risk identification, quantification and management (including mitigation) of the development option forms an integral part of the process.
A set of Guiding Principles is established to give guidance on the operation of the Process within a business context. One such principle calls for the creation of a High-Level Plan at the very beginning of a project and additionally a plan and cost to be submitted prior to funding each ongoing Phase or Stage.
So, in Project Value Management applied to capital projects in the various stages of project progression & decision-making, application of FAST analyses to Organization Functions can deliver a rigorous, compelling set of insights to the client. Results from Organizational Mapping workshops using the FAST technique engages senior management to support the resources necessary to make decisions in the face of uncertainty surrounding the implementation of the project management recommendations?
Engaging Organization Mapping in planning effective FEL is can be pivotal to success of project delivery. A short background in FEL follows.
 4 key take-aways – Most influence upfront, lowest cost, value gained or lost upfront, frame it wrongly and live with the problem. There will always be some uncertainty/risk (+/-) as one progresses – key is to recognize that and establish a reasonable mitigation plan.
The objective of FEL is to gain a detailed understanding of the project to minimize changes during later phases of project execution.
Better defined projects cost less to execute than do poorly defined projects for three primary reasons. First, as definition, including execution planning, improves, there is less likelihood that there will be delays in the design phase as well as in the field.
Second, as definition improves, there is less recycle with its attendant costs. Finally, because of fewer delays and less recycle, schedules will be faster, and fixed management and supervision costs will be reduced.
Thus, improving implementation of FEL leads to both more predictable project costs and lower absolute project costs with shorter schedules.
This is where application of the skills of a FAST applied to Organizations practitioner is particularly useful.
We will also discuss how to take the output from the Organizational FAST techniques and convert them to a resource- loaded project schedule
Applied Organization Mapping
A circular relationship exists between the overall system and its parts
Often an organization experiences similar problems repeatedly cycling through the organization. Over time, members of the organization come to recognize the pattern of events in the cycle, rather than the cycle itself.
By this time, the reader will no doubt have noticed the use of the term “Organization Mapping” rather than “FAST Diagramming.” The unfortunate reality is that while the technique employed uses the FAST Diagramming technique and requires the skill of guidance and facilitation expertise in the FAST Principles and Technique, many teams and clients prefer and accept the term “Organization and Interface Map” rather than the term “FAST Diagram” for a variety of reasons. We use the terms interchangeably in this article.
Often leaders tend to focus only on the behaviors and events associated with problems in the workplace, rather than on the systems and structures that caused the problems to occur in the first place. Therefore, it is important to have clarity of the Targeted Results, which are required to be delivered by the Organization, prior to attempting to build the Organization Map.
Engagement Background
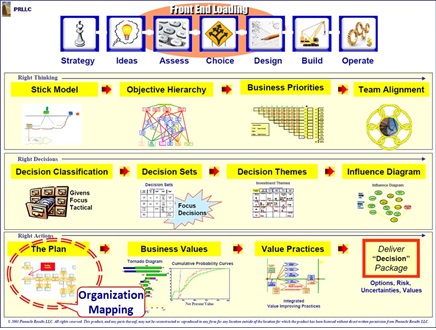 Prior to embarking upon Organization Mapping, which is the Kick-off for the FEL investment planning, “Right Actions,” it is important to have a team discussion on “Right Thinking” & “Right Decisions” format:
- Assess Opportunities as Assets.
- Frame the Potential Opportunity.
- Understand the Business and Social Priorities.
- Engage the Multidiscipline Project team.
- Specify the appropriate Tools and Analyses to be conducted.
We can then effectively start on plan using the Organization Mapping technique in Project Progression in the next FEL Phase and to define Roles / Accountabilities.
In the past, managers typically took one part of the organization or project delivery department and focused on that. Then they moved all attention to another part. The ongoing problem was often that an organization could, for example, have effective departments that operate well by themselves but do not integrate well together. Consequently, the organization suffers as a whole.
Now, many managers are recognizing the various parts of the organization, and, in particular, the interrelations of the parts, e.g., the coordination of central offices with other departments, engineering with manufacturing, supervisors with workers, etc. Managers now focus more attention on matters of ongoing organization and feedback. Managers now diagnose problems, not by examining what appear to be separate pieces of the organization, but by recognizing larger patterns of interactions.
Using Organization Mapping using FAST, now managers can focus on structures that provoke behaviors that determine events—rather than reacting to events as was often done in the past.
“Systems thinking” has been described as a way to view the world, including its organizations, from a broad perspective that includes structures, patterns and events, rather than only the events themselves.
 An excellent graphic to share the results of teams’ system thinking is the Organizational Map (Which has its legacy in the Function Diagramming tool or FAST developed by Charles Bytheway in 1953 originally to map functions in mechanical processes as a prelude to brainstorming for improving the delivery of those processes.
Significant work has been done to apply the FAST technique to Organizational Mapping over the last 20 years, and it is now a well-proven business tool to support systems thinking in Organization Design and Project Management.
Organization Design Insight
 While real world is often messy and uses incomplete information. The FAST methodology applied to mapping organization Functions provides a clever conversational platform for the project team to create a highly visible, scalable and agreeable functional plan. The FAST approach can tell a good project sequence of events in a simple manner. It creates and maintains an understandable and transparent work plan that includes all the requisite activities to deliver the project goals.
 Utilizing function analysis for organization mapping / analyses rather than for traditional product development is often a little more complex, since there may be multiple similar / identical function descriptions performed on different data and FEL phases in the Project development. So, the facilitator(s) needs to be both flexible and innovative with respect to the classic “Verb / Measurable Noun”
Organizations can be virtually identical to machines and product development. Unfortunately, organizations are much harder to control, can be highly unpredictable when left to their own accord and are often driven by individual personal agendas.
As such, the FAST methodology provides an effective tool to examine the requisite functions (and activities) required to achieve project FEL objectives such as the deliverables of the Decision Support Package required to approve funding of the next project FEL phase. The FAST focuses the project team (owners, designers and the execution team) such that these objectives and deliverables are clearly understood and agreed.
Decision to Use Organization Mapping
The decision to conduct an Organization Mapping Workshop can be driven by numerous reasons including for example:
- To clarify vague scope and activity sets
- To understand delivery risks
- To clarify Multi-discipline team work
- To identify and acquire resources in a timely manner
- Attain Management buy in
- Resolve unrealistic schedules to finish work
- Need to adjust schedules to accommodate overlooked activities
- Need to establish delegation to work fronts
- To keep Stakeholders in the loop
Prior to the Workshop
 It is very useful to conduct Stick Model Analyses, produce and agreed upon Stick Model Graphic prior to the workshop and take the team though the Stick Model in the Workshop
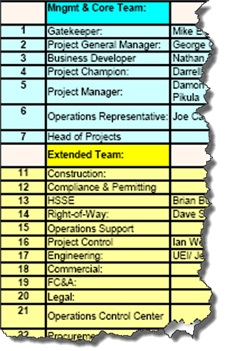
It is also extremely important to develop a “Chair List” prior to conducing the Organization Mapping workshop. In many projects, we do not know the actual name of the individual who will be tasked with and organization Function and/or activity. However, we do know the Job Title or “chair” that will be referenced. Therefore, we develop the Chair list from a Generic List provided to the team for editing. When conducting the workshop, we can then annotate the Organization Functions with the appropriate numbers from the chair list to speed up the process.
Additionally, the Project team will normally discover when the Organization Function Map is fully and logically developed according to the rigor of the How-Why logic there are additional “Chairs” identified who must be involved in progressing the project.
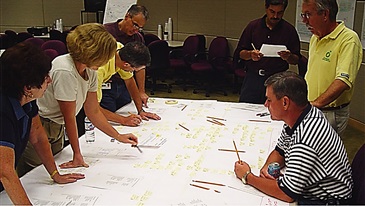
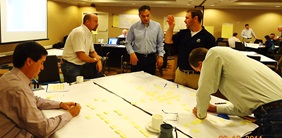
Working with the Project Team leaders prior to the workshop the team needs to be assigned in groups of 6-7 working on different areas of the Project. (It is quite usual to have 30 – 40 workshop participants working in teams on different areas of the project development with several facilitators).
If a Project Execution Plan and Statement of Requirements have been developed and are available they are printed for the teams to reference. Also, such data available associated with legal, environment and regulatory guidance.
Also, the Contents of the Decision Support Package to be presented will be copies for the participants.
While in any cases of mechanical process or product development the function analyses is developed essentially “from scratch” by the team, in the case of Organization Mapping it can be quite useful to have Generic Organization Maps for similar projects available for the teams to reference.
Conducting the Mapping Workshop
 The Facilitator(s) guide the teams through.
- Establishing an agreed work plan in functional terms that empowers the team to deliver compelling project solutions
- Guides project team for inclusion across all work fronts and disciplines
- Guides the team to ensure “task” activities are rational, realistic and satisfy the functional requirements
- Guides the team to assign the appropriate chairs with respect to Approval, Responsible and Supporting the Organization Functions. (There are many ways to assign these roles, however, over time we have found these terms fit best)
- AFTER, and only after, the initial Function Organization Map and assignments are agreed upon by all. The Facilitator then allows and guides the team to discuss and establish a work precedence that gives insight about a reasonable “real time“ schedule. The team documents direct and particle schedule precedence for the various Organization Functions.
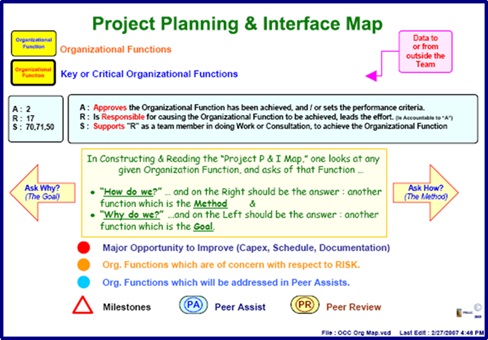
When asking “HOW do you (function)?” the answer is to the immediate right of that function. Reading from right-to-left in the WHY directions determine the system relationship of functions, or the goal of that function being addressed.
Project conversations require exchanging information (ideas) such that various views are examined and alternative understandings are created. Project team conversations are a collaborative process where data and knowledge are exchanged in a mutually satisfying manner (for each discipline and respective participant) that leads to clarity (completeness) of individual insight on the subject (scope) being discussed.
 The conversation must be a process that focuses the collaborative exchange and does not involve any pre-position (knowledge) or and post-activity (decision). The conversation must be bi-directional and each participant is obligated to help the other(s) to participate and to gain from the exchange. The conversation should provoke new insights and well as ground mutually agreed concepts. The Organization map provides a good conversation platform and allows for the mutually agreed activities to be documented in a clear, usable manner.
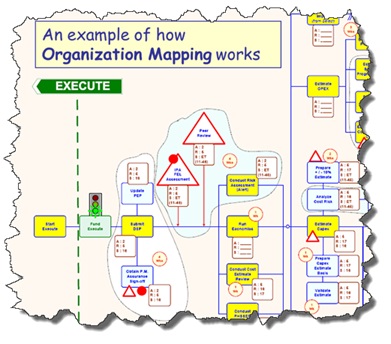
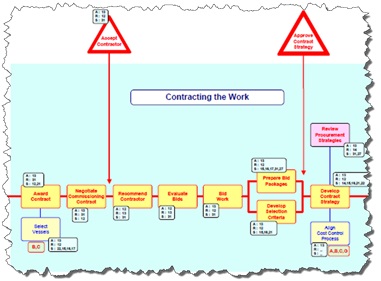
The Organizational Map is used to coordinate strategies across all work fronts within a project and within a program. The model provides auditable coordination across complex activity sets in an integrated manner and ensures that project values are is maintained across engineering & design, construction, commissioning, operations & maintenance considerations. The model deliverable documents the resulting mutual understanding advocated by the project team.
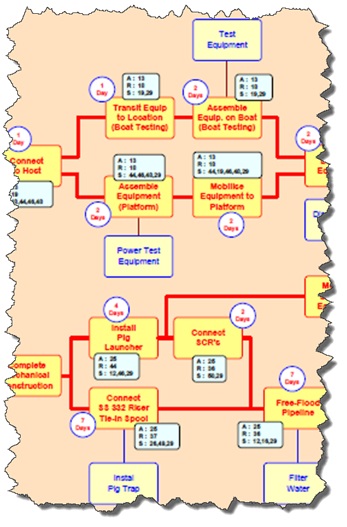
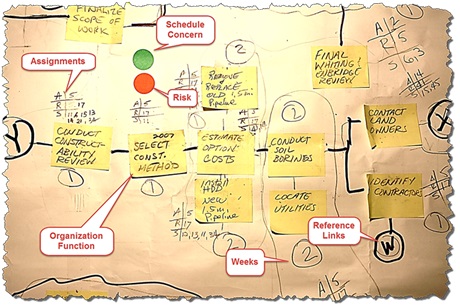 Shown is an example of the raw output from the workshop … this requires transfer to clear software and reprinting for the follow-up to the workshop and ongoing development of the deliverables.
In conducting these workshops often “swim streams” related to development of the various project parameters for input to the Decision Support Package analyses are useful to identify and assign to sub-teams. Examples of such swim streams could be Capital Expense, Operating Expenses, Revenue Generation, Legal, environmental and regulatory compliance and project controls and documentation imperatives.
Generally, these workshops require some significant minute to minute guidance by experienced facilitator(s) otherwise the teams can quickly “become confused” if they have not been previously exposed to the “How?-Why?” logic applied to Organization Functions.
In most cases the team will need an overview presentation of the workshop and examples the expected results prior to the teams starting their detailed work.
Deliverables and Follow-up from Workshop
 Teams should understand how the organization works and how it Should Work.
Otherwise, teams can get lost in the day-to-day activities of the organization, without giving attention to the more important work of planning the organization’s overall direction and effectively organizing the organization’s resources.
The team ends up working harder, rather than smarter and is less effective.
The consistent touchstone of a well-crafted Organizational Map is invaluable in maintaining that Team focus, Accountabilities, and Organization overall focus on delivering results.
The Organization Functions, which are required to be delivered, and which are shown in a well-crafted Organization Function Map, may change over time.
However, it is more often the case the Organization will be challenged with delivering the same Functions / Tasks / Activities with different approaches, results to focus upon & available resources.
The key is to fully understand the System, Organization Map for Clarity & Communication, and respond quickly to changing imperatives as they are presented to the Organization.
Communications and Planning: Critical for team success is ongoing communications among all the parts of the organization. Some of the first symptoms of an organization in trouble are sporadic and insufficient communications. Team members will struggle to see beyond their own roles in the organization. Without a clear understanding of the parts of an organization and how they relate to each other, it is difficult to know what to communicate and to whom.
The Organizational Map is normally dimensioned with Roles, Accountabilities, and can be further dimensioned with Project Management parameters to support building a Project Schedule in for example, Primavera or MS Project.
More effective organizational development: Effective Organizations use strategic planning, all level staff development, team building, supervisory development and principles of organizational change. In practice to be effective this demand a good understanding of the overall organization system, including its major functions, departments, processes, teams and individual employee contributions.
 Consequently, having an Organization systems view in a shareable simple easy to understand Organization Map graphic is critical to accomplishing effective organizational development.
Typical project management tools such as GANT charts and risk registers are not inherently constructive to identify potential information resources. Most project management tools are intended to identify and to manage “project task” (execution).
The “How?-Why?” logic of the FAST is much more likely to help the project team to capture existing information, alternative knowledge possibilities, and to accessible wisdom within the team participants and shareholder repertoire.
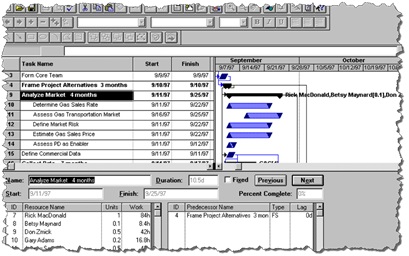
However, once the multidiscipline team has crafted the Organization Map together, and assigned the roles, accountabilities and assigned the first cut at durations and precedencies, the team can then populate a classic Project Management software.
There are various ways to do this. The standard Project Management software applications can normally import the resource list and assignments from Excel files, or from Access files which in turn can be generated form Visio charts.
Once we have a starter for the data in Primavera 6 or Microsoft Project or a similar application we can then reasonably easily develop a resource loaded schedule to progress the project. Since we now agree on the work to be done and the individuals and departments to perform the work we can make an estimate of the cost of progressing the project through to the next Decision Support Package towards funding.
 We can also agree on the level of effort required to deliver the rigor of decision support analyses is required by the Decision Maker to support ongoing funding.
A typical discipline map utilizes common elements and follows a common workflow. By utilizing the existing maps from projects around the world, common practices can be presented as a standardized approach for project leadership consideration. In some instances, project scenarios (onshore / offshore, jungle / desert) may be used to clarify map variations.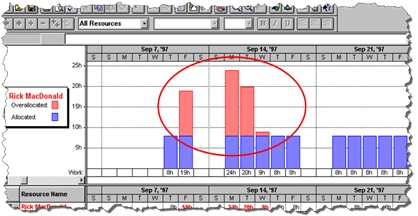
Conclusions
The authors have used function mapping methodology (Organization mapping, FAST diagrams) to investigate project opportunities and to help the project team plan appraise and select stage efforts. The mapping discussions are an extremely useful coaching tool that literally integrates the disciplines into an aligned project team.
The discipline map thus developed is a “living document” that can be used to monitor project schedules, to identify project resources (cost, manpower) and to inform others (management, contractors) about project scope.
The Organization Map using the FAST logic basis clearly:
- Establishes key work activities (areas) where processes are required
- Identifies issues that will require Project process focus – lead times, procurement terms, availability issues
- Provides a basis to evaluate processes for manpower requirements and issues such as labor and productivity factors.
- Provides a discussion basis for Project Management processes that can be improved.
- Encourages technology / communication issues to be identified and mitigation processes planned.
- Establishes clear interface processes with leadership and executive groups
The resulting Organization Map is a graphic and dataset that conveys the project development and objectives in a manner that is clear and supports efficient project progression.
The Organization Mapping with FAST methodology helps the project team to relate the “project story” in a reasonable, clear manner that can be understood by a broad project audience in an engaging and concise manner. It permits the Owner to examine the intended activities, to institute expectations, and to monitor performance. The map is a mutually agreed detailed project execution outline and establishes a requisite plan that will satisfies the Owner’s decision making needs.
The FAST map reinforces high performing team characteristics such as:
- work dedication and embracing challenges
- Clear vision
- Structure and alignment
- Discipline to perform
- Communication across work activities
- Recognized by stakeholders as following a prudent activity plan
Authors
Both Authors believe:
- The goal of Ethical Consultants’ and Coaches’ should be to ensure Client Teams are self-sufficient in the methods as soon as possible
- Even in “Down Markets” strong Project Teams can deliver improvement in project Capex, Opex and Return on Investment
- All business opportunities and project portfolios benefit from a proven and effective Front End Loading process
- Operating Teams with coaching in analyses can significantly improve Operating Expense and Production Efficiency and they can become self-capable very quickly
James D McCuish is a Partner in Pinnacle Results LLC & a former member of BP’s Integrated Business Modeling Team. He has served in both Management & Supervisory roles in Worldwide Operations for over 40 years in Energy Related Businesses. James has led and trained Project Teams in USA, UK, Norway, Netherlands, Belgium, Egypt, India, Indonesia, Argentina, UAE, Trinidad, Venezuela, France, Italy, & Singapore. Additionally, has served in Management and Operations capacities in Darwin, Gabon, Nigeria, Ireland, Oman, Indonesia and Denmark. He performs Project Team coaching, Value Engineering / Analysis, Value Improving Practices Decision Management / Analyses and Project Management. He has conducted VIP Studies and Decision Management Analyses in Oil, Chemicals, and Exploration / Production Sectors & Manufacturing Industries. He read Mechanical Engineering at The Queen’s University of Belfast. & holds a Dual degree, from Syracuse University, New York, in Management & in Business Administration; Summa Cum Laude, with University Honors in Management. Contact: phone: 832-794-2028, james@pinnacleresults.com.
Charles W. Jennings has 40 years’ experience in upstream oil and gas production activities. He has worked in subsurface, well completions, Subsea design, production operations, and has lead project teams in Trinidad, Norway, Egypt, Indonesia, United Kingdom and the United States. He holds a BSME and MSME from Louisiana Tech University. Experienced as a Front-End Loading (FEL) Advisor with BP and supported Major Capital investment teams worldwide using front-end appraisal methodologies, Project Strategy Planning & Modeling, Organization Development, Value Engineering / Analysis, Decision Management / Analyses and Project Management techniques. He is currently a Director in Pinnacle Results LLC and a Partner in Leading Edge Collaboration. Contact: phone: 713-501-0574, charles@pinnacleresults.com.