By Donald E. Parker, PE(ret), CVS
(The author has developed a composite Cost-Worth model based on function. This first article will discuss only the Cost Model portion of the composite model. A second article next month will discuss the Worth Model portion and its usefulness.)
The whole key to our value methodology is that people spend money on products to achieve desired functions. When they do that they are determining for themselves what the value of the function is at that point in time.
Allocating Cost to Function
Because the key element to value methodology is finding alternative ways to perform a function, one must know what the function costs (not the product or item cost).
Unfortunately, the cost for a product is much more prevalent than is data based on cost for functions performed by products. For example, assume a detailed cost estimate exists which amounts to $150,000 to air condition a small building. For simplicity, also assume that the air conditioning system serves only two functions. It “cools people” and “cools equipment” (such as light fixtures). If separate costs estimates do not exist for each of these functions, then the $150,000 cost estimate must be further analyzed and apportioned to each function.
- Where an item serves but one function, the cost of the item is equal to the cost of the function. For example, the cost of one item in a large project budget was $120,000 for a guard house. Therefore, the single basic function of the guard house, “shelter person,” would cost $120,000.
- Where an item serves more than one function, cost of the item must be prorated to each function. In the air conditioning problem shown above, one could calculate the air-conditioning load contributed by people as 40% of the total and the load from equipment as 60%. Then, 40% of $150,000 (or $60,000) would be the cost of the function, “cool people.” The balance ($90,000) would be the cost of “cool equipment.”
- If prorating is difficult, cost can be allocated to function by segregating functional difference between similar items. For example, assume the installed cost of an acoustical tile suspended ceiling with a flame spread rating of 25 or less, is $4.50 per square foot. Also, assume this system performs three functions: 1) “hides structure”, 2) “absorbs sound”, 3) “retards fire”. To allocate cost to these three functions requires a little detective work. The suspension system with no tile costs $2.50 leaving $2.00 for the mineral fiber tile that performs all three functions. One can purchase the tile without the flame spread rating function “retard fire” for $1.90. Hence the functional difference in cost is .10 cents. If one just wanted to “hide structure” without using perforated mineral tile, one could do that function satisfactorily for $1.10. That leaves .80 cents for the “absorb sound” function as its cost.
Example Function Cost Model
The example that I have selected to use to show my Function Cost Model is the Library Project illustrated in Section D2, page 61 of SAVE International’s new Function Analysis Guide. The Guide illustrates the resource used as space GSF (Gross Square Feet). I am using dollars as the resource in my model.
As you can see below, I use a vertical model format. I like that it calculates in an excel spreadsheet format and fits on an 8.5” x 11” sheet vertically to fit in my VM workshop reports easy to read.
The first line I place the whole item under study – the Library – its function and its total function cost with whatever measure and quantity I desire to calculate function unit cost. Then my level two of the work breakdown structure of the library is indented and listed below. If I wanted a level three on any component, I would place it below the level two component and indent those lines once again. I have never had to make a model with more than those three levels.
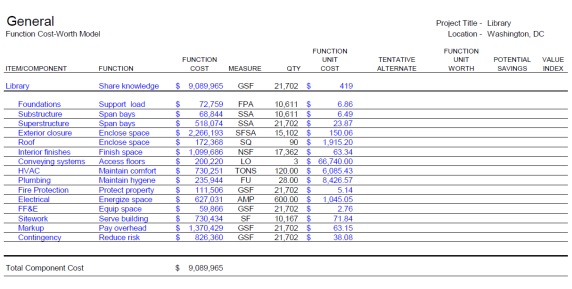
The purpose of having levels two and three (if necessary) are to be able to express unit function cost in terms of parameters measures and quantities appropriate to the item being priced. For buildings, the UNIFORMAT system structure is the most commonly used and consists of the following:
System Parameter Definition
Foundations FPA Footprint area in square feet
Substructure SSA Supported structural area in square feet
Superstructure SSA
Exterior closure SFSA Square foot of surface area
Roofing SQ Squares (100 sf each)
Interior work NSF Net square feet
Conveying systems LO Landing openings
Plumbing FU Fixture units
HVAC TONS 1 ton = 12,000 btuh
Fire Protection GSF Gross square feet
Electrical AMPS Connected incoming service load
Sitework ACRES
Utilities LF Lineal foot of each incoming utility
Markup PCT Percent of overhead & profit
Preparing for a Value Study
To prepare for a value study, I prepare the first five columns on the left side of the model which represent the function cost model. The computer calculates column six. During the information phase of the study, I go over the cost model section of the format explaining how I put it together.
As will be discussed in the next article, the team completes columns seven and eight in a short period of time. The computer calculates columns nine and ten.
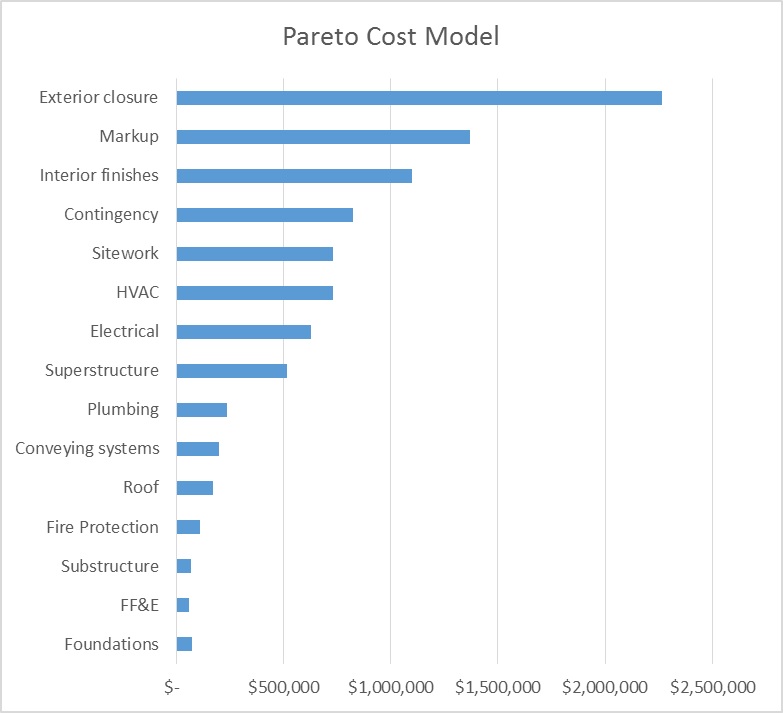
Tentative Conclusion
At this point, the team could only pick the highest cost components of the library to study following Pareto’s Law of Maldistribution which says that 20% of the components of tend to contain 80% of the cost. See Pareto diagram below:
Next month, I will show how function worth will narrow that target with much more confidence.